The global cities exhibition exhibition is about people and places and making people aware of what the growing populations of cities is going to mean to them.
The main thing which is evident when I entered the exhibition space was the shear volume of information, but the key to this exhibition is that it has many ways of displaying information to guide you through learning without feeling overwhelmed with information.


There are images of the various urban areas displayed in a number of different graphic styles. different colours, tones and lines help to create this difference, so no one piece of infomation is interpreted as meaning the same as the last. The photo above was a very good example of how imformation was broken down into these different styles.


The most effective means of visually displaying the demograhics data in this exhibition was probably the 3D models representing space of the city and population density. These at times seemed like giant termite mound, however were in my opinion the most interesting visually displays of information. There were five city models and each showed such differnt characteristics to one another, it was a fascinating way to represent this kind of data.


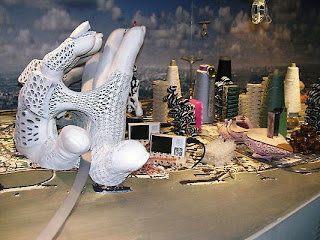
The fun of this exhibition was the way in which information which is usually displayed in boring graphs or charts, has had a sense of fun injected into it. The model of London was an example of this it had a 2D detailed colour base plan of London but key landmarks and features were picked out using any number of different materials, each material had some significance to the actual area. The cotton reals are tower blocks in the financial part of london representing comodities and trading the westminster/parliament area of London was represented by an amalgamation of tourist trinket. This was a really playful model which experimented with materials but put real thought into how they were used.


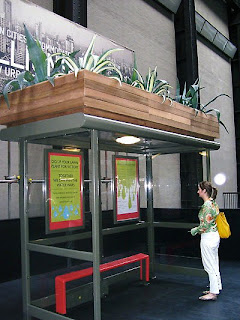
The exhibition used varied media to represent information which most of the time would be statistical charts and graphs. The fun and thought really translat through the works even subtle things such as lamposts and signs with messages on them to bus shelters with plant boxes on top of them. This is definately an eye opener for how to use varied media in such an effective way.
No comments:
Post a Comment